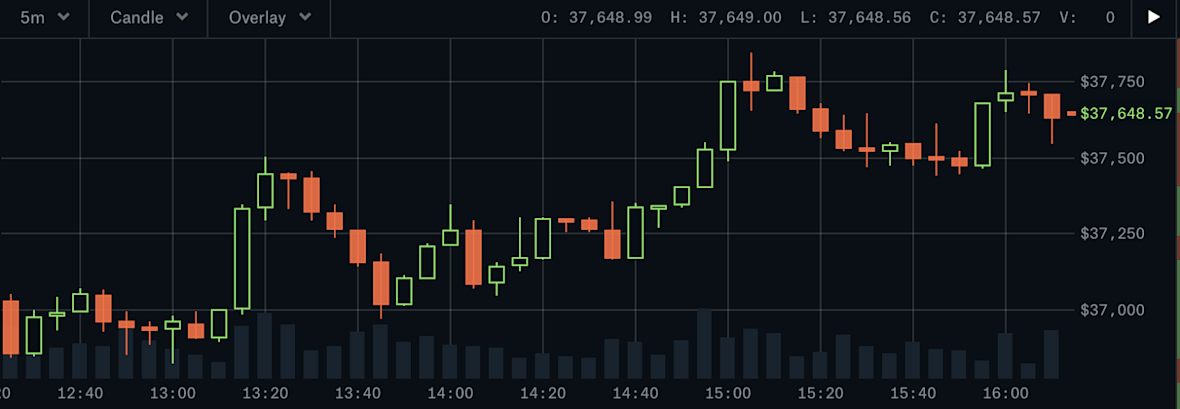
If you’ve ever looked at a crypto trading chart, you might have felt a little overwhelmed. All those red and green candles, weird shapes, and lines moving up and down—it can seem like a foreign language. But once you understand the basics, reading candlestick charts becomes a powerful tool to help you make smart decisions when investing or trading crypto.
This guide will break it all down in simple terms, so you can start reading candlestick charts with confidence.
What Is a Candlestick Chart?
A candlestick chart is a visual way to show the price movements of an asset—like Bitcoin or Ethereum—over time. Each candlestick represents a specific time period (such as 1 minute, 1 hour, or 1 day), and it shows four key things:
- Opening Price – where the price started at the beginning of that time period.
- Closing Price – where the price ended at the end of the period.
- Highest Price – the highest point reached during that time.
- Lowest Price – the lowest point during that time.
Each candle gives you a snapshot of price behavior. When you put many candles together, they create a pattern that helps traders predict what might happen next.
Anatomy of a Candlestick
A candlestick has two main parts:
1. The Body
- This is the thick middle part of the candle.
- It shows the difference between the opening and closing prices.
- If the candle is green (or white), the price went up—the close is higher than the open.
- If the candle is red (or black), the price went down—the close is lower than the open.
2. The Wicks (or Shadows)
- These are the thin lines above and below the body.
- The top wick shows the highest price during the time period.
- The bottom wick shows the lowest price.
Imagine a candle: the wax is the body, and the string is the wick.
Example: Reading a Single Candle
Let’s say you’re looking at a 1-hour candlestick on a Bitcoin chart.
- Open: $30,000
- Close: $30,500
- High: $30,700
- Low: $29,800
In this case:
- It’s a green candle (because the close is higher than the open).
- The body covers from $30,000 to $30,500.
- The top wick goes up to $30,700.
- The bottom wick goes down to $29,800.
This tells you Bitcoin went up during that hour, but it had a bit of a rollercoaster ride.
Timeframes: What Do They Mean?
Candlestick charts can be shown in different timeframes, depending on your goal:
- 1-minute, 5-minute, or 15-minute charts: Good for day traders who want to move quickly.
- 1-hour or 4-hour charts: Helpful for short-term trades.
- Daily or Weekly charts: Better for long-term investors.
Each candle represents the price action within the selected timeframe. For beginners, starting with the daily chart is usually easiest.
Common Candlestick Patterns
Certain candlestick shapes and combinations can help you predict what might happen next. Here are a few beginner-friendly ones:
1. Doji
- Looks like a cross or plus sign.
- The open and close prices are nearly the same.
- It shows indecision in the market—price could go either way next.
2. Hammer
- Small body at the top, long wick below.
- Found at the bottom of a downtrend.
- Often a signal of a bullish reversal (price might go up).
3. Shooting Star
- Small body at the bottom, long wick above.
- Found at the top of an uptrend.
- Often a signal of a bearish reversal (price might go down).
4. Engulfing Pattern
- A large candle completely “swallows” the previous small candle.
- Bullish Engulfing: Green candle engulfs a red one → price might rise.
- Bearish Engulfing: Red candle engulfs a green one → price might drop.
These patterns don’t guarantee anything, but they give clues about market mood and potential direction.
Support and Resistance Levels
When reading candlestick charts, traders also look for support and resistance levels.
- Support is a price level where the asset tends to stop falling—it’s like a floor.
- Resistance is a price level where the asset tends to stop rising—it’s like a ceiling.
If a candlestick breaks through one of these levels, it could mean a trend change is coming.
Trend Analysis
By looking at a series of candles, you can spot the trend:
- Uptrend: Higher highs and higher lows.
- Downtrend: Lower highs and lower lows.
- Sideways: Prices move in a narrow range—no clear direction.
Understanding the trend helps you decide when to buy, hold, or sell.
Tips for Beginners
- Start with Daily Charts – They’re slower-paced and easier to understand.
- Don’t Rely on Candles Alone – Use other tools like volume, moving averages, or RSI.
- Practice on Demo Accounts – Platforms like TradingView let you explore charts risk-free.
- Look for Confirmation – One candle pattern isn’t enough—wait for a second signal.
- Be Patient – Reading charts is a skill. It takes time and practice.
FAQs About Reading Crypto Candlestick Charts
1. Why are candlestick charts better than line charts?
Candlestick charts give more information than line charts. They show not just the closing price, but also the high, low, and open—giving a fuller picture of market behavior.
2. How do I know if a candle is bullish or bearish?
A green candle is bullish—it means the price went up during that time. A red candle is bearish—it means the price went down.
3. Do candlestick patterns always predict price movements?
No. Candlestick patterns give clues, but they aren’t 100% accurate. Always use them with other tools and wait for confirmation before making a trade.
4. Which time frame is best for beginners?
The daily time frame is best for beginners. It’s slower, gives more reliable signals, and helps you learn without the pressure of fast changes.
5. Can I use candlestick charts for long-term investing?
Yes. Even long-term investors can use candlestick charts to spot trends, entry points, and market reversals over weeks or months.
Final Thoughts
Reading crypto candlestick charts might feel complicated at first, but with a little practice, it becomes second nature. You don’t need to memorize hundreds of patterns. Just start with the basics—know what each candle means, how trends form, and what signals to look for.
With time and effort, you’ll be able to read the story that each chart is trying to tell—and make smarter decisions with your crypto investments.